Social Networking Analysis (SNA) is a useful tool to assess and document the community building that results from participation in institutional educational programs in an academic health sciences center.
Introduction: Education academies often list community building as an important goal, but there is a lack of clarity around why this is important and how it might be evaluated. Social Capital Theory (SCT) is a useful framework for understanding the importance of community building but there are no published reports of measurement of social capital in members or participants in education academies.
Methods: The authors used Social Network Analysis, specifically network mapping using Gephi, an open-source network visualization software application, to document changes in the social network among participants in an 18-month fellowship focused on educational scholarship and compared the resulting map with the same data presented in tabular form.
Results: Two of the authors collected data from each of the 23 fellows and two of the authors with expertise in the use of Gephi produced network maps representing relationships before and after fellowship participation. The data were also analyzed statistically using the Wilcoxon signed rank test. The network maps visually depicted the increased connections among fellows and it was easy to see the changes for each individual. Statistical analysis confirmed that the change in connections was significant.
Conclusion: Network mapping is a useful tool for examining the development of strong and weak ties among participants in a program of an educator academy. This approach could offer a mechanism to document value of such programming.
As academic health science centers have increased their recognition of faculty whose scholarship is focused on education, academies such as Emory University’s Woodruff Health Educators Academy (WHEA) have emerged as an important resource for career development of educators. WHEA supports faculty and staff educators from the entire Woodruff Health Sciences Center, including: 1) the Nell Hodgson Woodruff School of Nursing, Rollins School of Public Health, and Emory University School of Medicine; 2) the anesthesiologist assistant, physician assistant, physical therapy, genetic counseling, and radiological sciences programs; and 3) the Emory health care system. One stated goal of WHEA, articulated in its vision statement, is “to foster an interprofessional community of educators across the health sciences at Emory” (http://whsc.emory.edu/education/whea/index.html).
Although community building is a common goal within education academies, there is a lack of clarity around why it is important and how it might be evaluated. Authors from the Duke Academy for Health Professions Education and Academic Development (Duke AHEAD) described the use of Social Capital Theory (SCT) as a framework for understanding what is gained by community building and what unintended consequences it might bring, particularly when creating communities to support interprofessional education activities. The authors concluded by stating that SCT could be used to guide further study of this issue but did not propose methodology for doing so (Lee, Grochowski, Valiga, von Isenburg, M., & McNeill, 2019).
We also chose SCT as a lens for viewing the importance of community building as a goal of WHEA. Social capital can be defined as a resource that is created by relationships between people that leads individuals to provide information and support to each other when necessary (Adler & Kwon, 2021). In academic health sciences centers, educators are often separated from each other by school, department, discipline, and/or location, making it difficult to create a sense of community. This disconnect can hamper the ability to build social capital that can support the development of successful careers in education.
At a more granular level, SCT distinguishes between strong ties, often occurring among members of one group and leading to network density, and weak ties that are more commonly found between individuals representing different groups and lead to network range (Burt, 2000). Both density and range imbue a network with social capital, although in different ways. Dense networks help establish social capital among members of communities or groups with an important similarity, such as living in the same neighborhood, having a common hobby, or being of the same profession. That social capital helps establish community norms and solidarity. Networks with wider range generally confer social capital by connecting communities and bringing in new ideas and information (Burt, 2000; Haythornthwaite, 1996).
In higher education in general, wider range and lower density networks have been associated with better career outcomes for faculty members and professional networks acting as invisible levers that advance faculty careers by “providing information, influence and allies that grow social capital” (Niehaus, E. & O’Meara, 2015, p. 160). This trend seems likely to be true in health professions as well, and education academies provide the opportunity for educators from different parts of their institutions to create those connections. The challenge for all such academies is finding methodology to measure the growth of social capital through academy participation.
We chose Social Network Analysis (SNA) to explore the creation of social capital in our education academy. SNA is a technique for studying information exchange organically, focusing on patterns of relationships (Haythornthwaite, 1996), and is a useful approach to investigating the social capital of a community (Lee, 2014). One approach to SNA is the use of network mapping, which can display the structure of a community along with its density and visually depict relationships among individuals (Camacho, Panizo-LLedot., Bello-Orgaz, Gonzalez-Pardo, & Cambria, 2020). We posited that by comparing network maps at two different moments in time we would be able to see increased ties among members of our community and, therefore, increased social capital. The intent of this work was threefold: 1) to document the feasibility of SNA in studying community building; 2) to detail the change in the social network of a cohort of fellows participating in a WHEA fellowship program using network mapping; and 3) to compare network mapping to tabular presentation of data in terms of understanding the creation of community. This project was part of an evaluation study of the Fellowship in Educational Scholarship that was approved as exempt by Emory University Institutional Review Board (protocol IRB00106532).
We studied one WHEA program, the Fellowship in Educational Scholarship (FES). FES is an 18-month interprofessional program consisting of expert-led large group workshops to teach educational research skills coupled with participants completing mentored scholarly projects. Fellows were divided into five project groups, each with two facilitators that met monthly for the length of the program to provide support and feedback as they planned and implemented their projects. The first cohort of 23 fellows began the program in September 2018 and completed it in March 2020. The participants were both interprofessional and interdepartmental, representing several distinct units within the Woodruff Health Sciences Center. Two participants were faculty in the Nell Hodgson Woodruff School of Nursing, one was from the Rollins School of Public Health, and the rest were faculty or staff in the School of Medicine, including one physician assistant, one psychologist, one basic scientist, the director of the human simulation program, and 16 MD clinicians from 5 clinical departments.
We collaborated with members of the Emory Center for Digital Scholarship (ECDS) (SP, JM) who had the technical expertise and software necessary to create social network maps. With their input we developed a preliminary data collection form. Two of the authors (LL and KM) collected data from all 23 graduating fellows between March and June 2021, 12-15 months after completing the fellowship.
The same two authors jointly collected preliminary data from three fellows to ensure clarity and consistency. Afterward, necessary modifications were made to the data collection form with input from ECDS. Subsequent data collection took approximately 20 minutes per fellow and was conducted by one of the interviewers virtually. We asked respondents to first identify, from a list, those fellows with whom they had a connection prior to the fellowship and to label those relationships as weak or strong. The definitions of weak and strong relationships were left to the discretion of each respondent, as there is no standard used to define those terms (Haythornthwaite, 1996). Next, respondents were asked to identify those fellows with whom they currently had a connection and to note if those connections were weak or strong. Responses were recorded on an Excel spreadsheet with a tab for each fellow.
Interview data were transformed into two network data tables: nodes and edges. The nodes table contained the list of respondents identified by an anonymized label. The edges table contained a row for each relationship described in the responses as a connection between a source node (the person providing the response) and a target node (the person being described) as well as information about whether the relationship described was before or after the program and if it was weak or strong.
The resulting network data were imported into Gephi, an open-source network visualization software application (https://gephi.org) Within Gephi, we filtered the data to generate social network maps showing connections before and after the fellowship; connections were colored in gray to represent weak connections and black to represent strong connections.
We used the Fruchterman-Reingold algorithm to visualize the social network map before the fellowship. Fruchterman-Reingold is a force-directed network algorithm that places nodes with more connections closer to one another and arranges the entire network as a circle with the most connected nodes at the center (Fruchterman and Reingold, 1991). The positions of the nodes were then fixed and the connecting lines for the social network after the fellowship were loaded. The nodes were kept in identical positions before and after the fellowship to make connection comparisons easier to visualize.
Using our Excel spreadsheet data, we calculated the median number of total ties, strong ties, and weak ties that each fellow had to other fellows before and after the program. Using IBM® SPSS® Statistics 27, we ran the Wilcoxon signed-rank test to determine whether there was a statistically significant increase of ties after the fellowship program.
Our first objective was to investigate the feasibility of SNA in studying community building. We found that the process of mapping was doable with the help of the experts in the ECDS who are familiar with Gephi. Although our process was streamlined by having local expertise, others without the same resource can learn to use Gephi using a variety of free online materials.
Our other two objectives were related: we wanted to understand how the relationships among our fellows changed from pre- to post-fellowship and to compare the utility of displaying the data as network maps to presenting it in a tabular format. Figure 1 shows the network maps of the strong and weak ties among the 23 fellows before and after the program. Visually, it is clear there are many more connections among participants after FES and increases in both strong and weak ties. In this cohort of participants, representing more than 10 different areas of the health science center, the new ties displayed increased density and range, as many were found between fellows from other parts of the institution (Figure 2). Additionally, the network map provides a way of investigating the change for each individual, especially for those who started the program with few ties, and therefore for whom participation might have provided the biggest change in social capital.
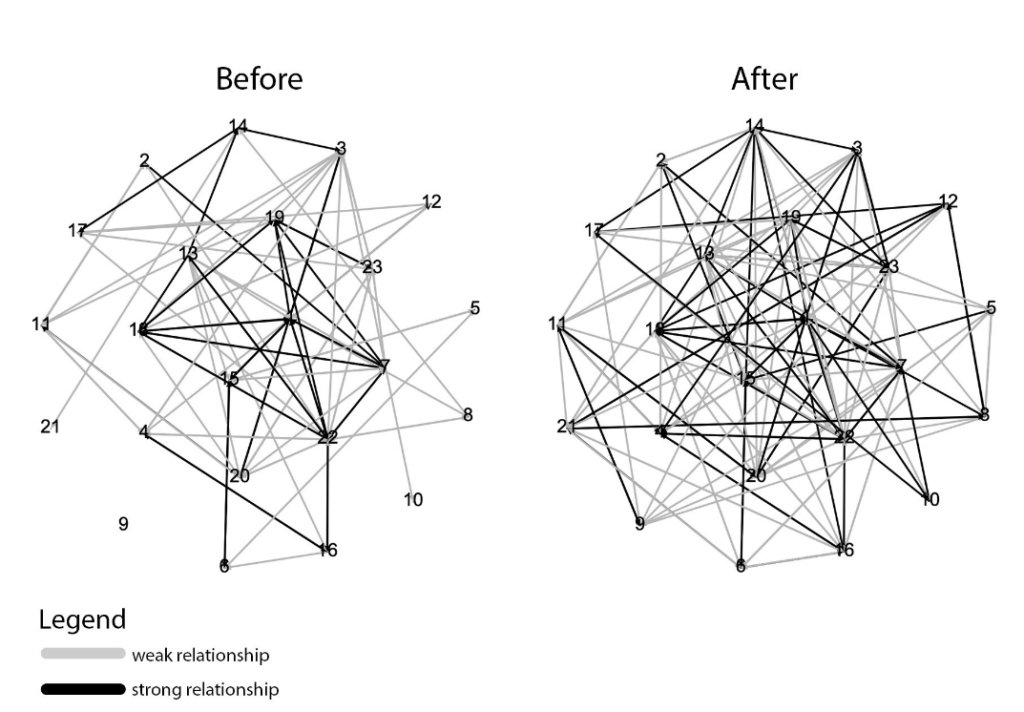
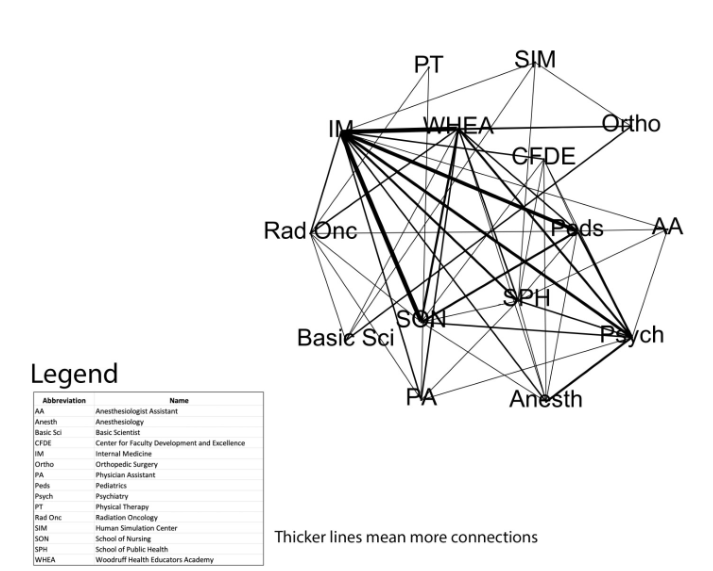
Table 1 shows the same data as the median number of total ties, strong ties, and weak ties among fellows before and after FES. A Wilcoxon signed rank test revealed that total number of connections were significantly higher after the fellowship program (Md = 7, n = 23) compared to before (Md = 4, n = 23), Z = -4.038, p < 0.05. The same was true for strong and weak connections before and after the fellowship. While these data are useful in providing statistical evidence that fellows had more ties to each other after the program than before, and therefore an increase in social capital, they do not allow identification of outliers who either greatly increased their connections or who didn’t create any new connections at all.
Table 1: Median number of connections between participants before and after Fellowship in Educational Scholarship. | ||||
| Before (N = 23) Median (Range) | After (N = 23) Median (Range) | Z | P |
Total connections | 4 (0-13) | 7 (2-16) | -4.038 | .000 |
Strong Connections | 1 (0-7) | 3 (0-7) | -3.551 | .000 |
Weak Connections | 3 (0-7) | 4 (1-9) | -2.976 | .003 |
Our findings provide preliminary evidence that SNA is a useful method for studying community building. The network maps allowed us to create qualitative evidence of social network growth that is based on carefully collected quantitative data and is intuitively understandable, allowing the viewer a more visceral feel for the significance of the outcome. The tabular data, with statistical information, is a useful adjunct in supporting the more qualitative understanding gained by studying the maps.
The next steps in deploying network mapping to investigate social capital created by participation in an education academy include simplifying data collection and then studying participants in other WHEA programs. The main challenge to expanding our current approach is the time it takes to collect data from individuals of interest. We spent approximately 8 hours speaking individually with our 23 fellows the data collection spreadsheet; one of our next steps will be to create a simpler data collection form that can be administered as a survey that individuals can complete on their own. We then plan to expand the use of SNA to additional WHEA programs and to ultimately look for any correlations between increased ties that result from program participation and rates of career advancement.
Additionally, it would be interesting to explore the ties that were created in a qualitative way, to better understand what causes individuals to experience a relationship as weak or strong, and how different relationships contribute to the career progression of individuals going forward.
In summary, SNA is a useful tool for investigating whether interprofessional programs and education academies are achieving their goal of creating community and social capital for participants. Network maps provide a visual representation of the development of strong and weak ties among individuals. Their use in documenting growth in such areas offers a strong argument for the utility of educator academies to academic health sciences centers and shows promise in displaying the impact of a variety of training programs and justifying their ongoing support.
This project was part of an evaluation study of FES that was deemed exempt by Emory University Institutional Review Board (protocol IRB00106532). The authors received no grant support for this work, received no payment or services from a third party for any aspect of the submitted work, and declare they have no conflicts of interest in regard to this work.
Adler, P.W. & Kwon, S.W. (2002). Social capital: prospects for a new concept. Acad Manage Rev. 27(1), 17-40.
Burt, R.S. (2000). The network structure of social capital. Res Org Behav, 22(1), 345-423. doi.org/10.1016/S0191-3085(00)22009-1
Camacho, D., Panizo-LLedot, A., Bello-Orgaz, G., Gonzalez-Pardo, A., & Cambria, E. (2020). The four dimensions of social network analysis: an overview of research methods, applications, and software tools. Inf Fusion. 63(1), 88-120. doi.org/10.1016/j.inffus.2020.05.009
Fruchterman, T.M.J. and Reingold, E.M. (1991). Graph drawing by force-directed placement. Software: Practice and Experience. 21(1), 1129-1164.
Gephi. Gephi website. https://gephi.org.
Haythornthwaite, C. (1996). Social network analysis – an approach and technique for the study of information exchange. Libr Inf Sci Res. 18(1), 323-342. doi.org/10.1016/S0740-8188(96)90003-1
Lee, L.S., Grochowski, C.O., Valiga, T.M., von Isenburg, M., & McNeill, D.B. (2019). Building social capital to foster interprofessional education: the interprofessional educator academy. Acad Med. 94(1), 1685-1690. doi: 10.1097/ACM.0000000000002807
Lee, M. (2014). Bringing the best of two worlds together for social capital research in education: social network analysis and symbolic interactionism. Educ Res. 43(9), 454-464. doi.org/10.3102/0013189X14557889
Niehaus, E., O’Meara, K. (2015). Invisible but essential: the role of professional networks in promoting faculty agency in career advancement. Innov High Educ. 40(1), 159-171. doi.org/10.1007/s10755-014-9302-7
The Woodruff Health Educators Academy. Woodruff Health Educators Academy website. http://whsc.emory.edu/education/whea/index.html.
Assistant Professor, Anesthesiology, Emory University
Digital Projects Specialist, Emory Center for Digital Scholarship, Emory University
Digital Text Specialist, Emory Center for Digital Scholarship, Emory University
Director & Assistant Professor, Educational Development & Scholarship and Department of Medicine, Emory University School of Medicine
Professor, Pediatrics, Emory University